

|
|
||||||||||||||||||||||||||||||
|
||||||||||||||||||||||||||||||
|
|
|
|
||
 |
EXTREME TROPO: A CASE STUDY
 EXTREMELY HOT AIR TEMPERATURES On the day prior to the reception, November 27th:
In the far northwestern, southern & western NSW, respectively, temperatures of 37.9 degrees were reached. The temperature reached 37 degrees at Gatton (near Brisbane). On the day of the reception, November 28th:
Why this month, November 2009, was noteworthy:
It is the view of the NSW Climate Services Centre that these crazy temperatures were likely caused by the presence of El Niño in the equatorial Pacific Ocean.
SLUGGISH HIGH PRESSURE SYSTEMS 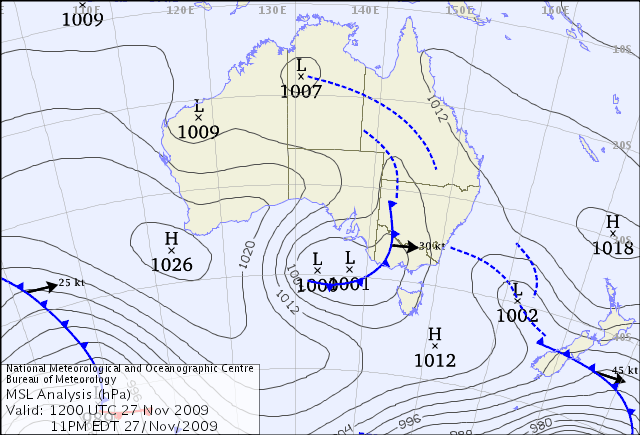 Above: Conditions just hours before the reception. There is a high pressure system located in the Tasman Sea between New Caledonia and Northern New Zealand. This high had been 'sitting there' doing very little since November 25th. Note also the trough of low pressure across southern Queensland.
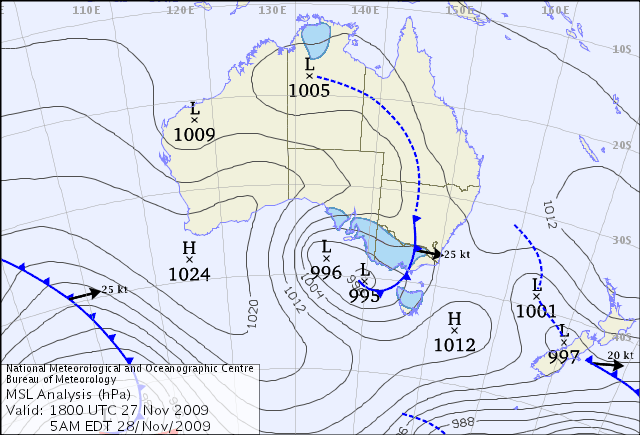 Above: Conditions at the approximate peak of the reception. Early Morning of November 28th, 2009. Note that the high is still there. These near-stationary highs were also the likely cause of the extreme temperatures. 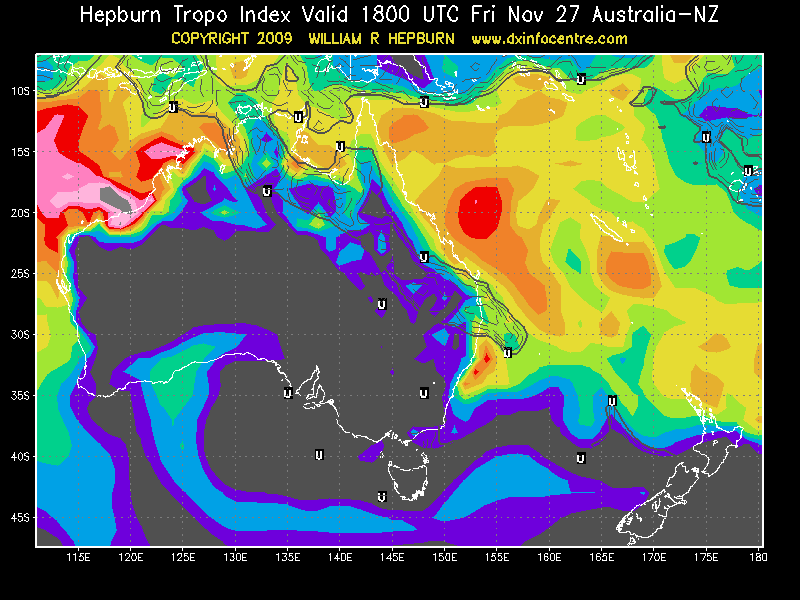 Above: The latest updated Hepburn chart for the approximate time of the reception. Note the orange around the NSW North Coast. Left & Below: A full day after originally hearing the reception, I went for a late night drive up to Clear Mountain - with an elevation of 247 metres - just in case. To my surprise, Norfolk was still clearly audible. Upon returning home, Norfolk was not audible using my antenna. Note the blood red around the NSW North Coast. Norfolk Island FM was also received on the evening of August 24th, 2009. In the interests of brevity, that reception is not detailed on this website. Nonetheless, here is a brief analysis of the conditions I experienced at that time, in the hope that patterns can be found.  Above: Firstly, we view the synoptic chart for the morning before. Note again a big 'juicy' high stretching from New Caledonia to Northern New Zealand! Note again a large cold front (shown as barbed lines) moving eastwards. Secondly, we view conditions just hours before the reception occurred.
I must admit this was the first time I have experienced this sort of tropo from around 5:30pm. It pays to listen to your radio even at these unusually early evening periods. Experienced enthusiasts generally seem in agreement that the best times to catch tropo are between 7pm and 11am, which I find easy to remember as the 7-11 window. Typically tropo peaks at the most inconvenient times, when you really wish to be in deep sleep! This instance served as a good reminder to me that there are always exceptions. I would argue that, as we get more experienced, the only thing we know for sure about propagation is just how much we don't know! Just like life, except possibly a little more predictable! The opinions expressed are my own, unless otherwise noted. My commentary should not be construed as anything other than a lay person's observations. If you find this interesting, you might like to check out the Bureau's page which helps explain how to interpret synoptic charts.
Hepburn Tropo charts are provided courtesy of legendary DXer & meterologist William Hepburn. Copyright 2009 William Hepburn. The copyright owners retain exclusive rights to their works. Detailed weather data can be found in the Bureau of Meteorology's Monthly Weather Review archives. Temperature data provided by the Queensland & NSW Climate Services centres have been used to compile this report. These centres are divisions of the Bureau. |
|
|
|
||

| Site Map |